Polar Equations Explorations
By
Cassian Mosha
Investigate: ![]()
Note:
* When a and b are equal, and
k is an integer, this is one textbook version of the " n-leaf rose."
* Compare with![]() for various k.
What if
for various k.
What if![]() is replaced with
is replaced with![]()
Explorations:
We will use graphing calculator to investigate this. We will try different values of a, b and k and see how the graphs behaves. LetŐs now set a, b, and k equals 0 and see what kind of graph do we get. We did not get any graph, it was just a point on the origin and thatŐs why we did not see any graph. Everything was shrieked to zero. Now let's set a, b and k equals 1. here we got a graph that was earlier hinted to be a leaf rose, and since k=1 then it is a one leaf rose. The graph below shows the one leaf rose.
![]()

Figure 1 with a=b=k=1
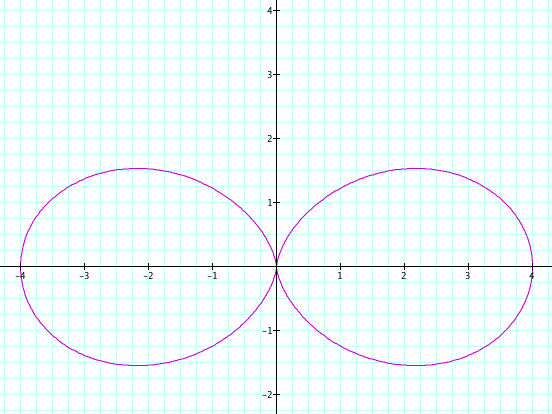
Now let's try with even values of a, b, and k and say a=b=k=2. We get the figure below which looks like two egg tangent to each other or pair of ellipse tanget to each other and symetrical at the origin. We also tried for the odd numnber and we got the same shapes with the number of leaves equal the value of k. All leaves were symetrical at the origin.
![]()

Figure 2 With a=b=k=2
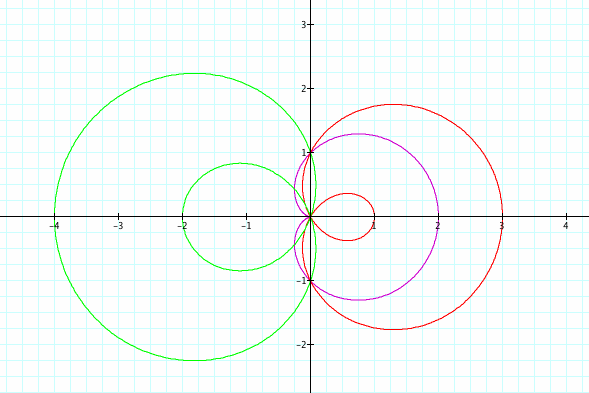
Now let.s go back and try to fix a and k and change b and see what happens; say a=1, b=2 qnd k=1 comparing to the first graph with a=b=k=1. We found the graph to be as shown below and the red is called cardiod.

Figure 3 the Red with a=1, b=2 and k=1
Suppose we dicide to use negative nunbers what kind of images should we get? Let a= -2, b= -3 and let k remain the same as the above two cases, that is k=1. as we can see in the green graph we got almost the same figure as for the above case except now is on the negative side of the x-axis to reflect the values of a and b.

Figure 4 Green with a=-2, b=-3 and k=1
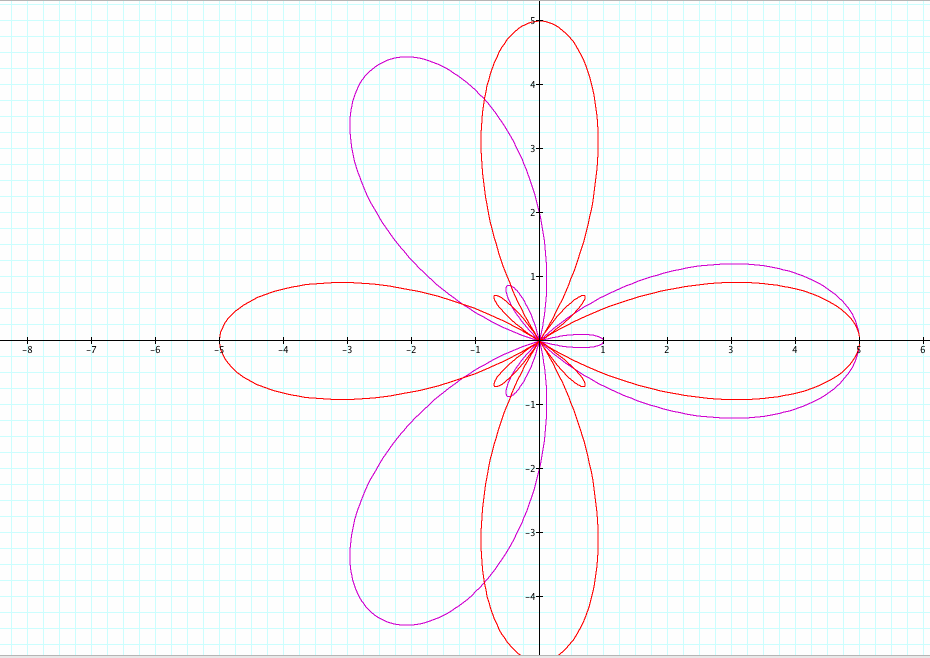
We saw above that as we keep the value of k constant we got figures in shapes of cardiod and it is situated in the either positive or negative side of the x-axis depending on whether a amd b is positive or negative. Now let's fix a and b and vary k for even number and odd number and see what happens. We will draw two different graphs on the same set of axis to be abble to compare them first hand. Lets say a=2, b=3and k=3 and 4. Lets draw the graphs and see the shapes. The purple part is the k=3 and the red shapes are for k=4 I observed three leaves for the purple while for the red I observed four big leaves and another four small ones. It seem like there is a pattern here, but let me try again with a smaller number say k=2 for even and k=3 for odd.

Figure 5 with a=2, b=3 and k=3 Purple for odd, and k=4 Red for even

Figure 6 a=2, b=3 k=3 the purple and k=2 the red
Here we see that the purple leafs are three, while the red ones are four. Looking at this patternn we can conclude that k indicates or determines the nunber of rose leafs in different situations.
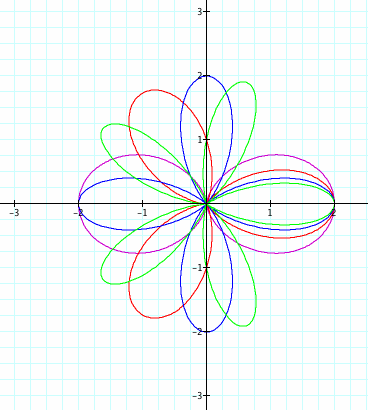
Let's now look at the comparison part: that is when r=bsin(ktheta) and see whether we can see something similar or different, It will be a good idea to draw all different graphs on the same set of axes since it will be easier to compare the graphs. We will fix the value of b and vary k to see what happens.Let k be 2,3,4,and 5. Lets draw the graphs one by one on the same set of axes and do some exploration.

Figure 6a k=2purple, k=3 blue, k=4 red and k=5 green
When k was equal to 2 the number of leaf pedals were 4, for k=3 the leaf pedals were 3, k=4 we found 8 pedals and finally with k=5 we observed 5 pedal leafs. We can conlude by looking at the numbers and observe a pattern that when kis even there is 2k pedals and when kis odd we obseve just k pedals. The question nowis what will if we change from cos to sin based on our original equation, We will draw different graphs one at a time to explore whether there is something similar to cosine function, Let k= 1,2,3, 4 and 5

Figure 8: a+bsin(ktheta)
In this case we saw the whole thing animating and rotating in 3D. With k=1 it was a one complete leaf piece in 3D while the others follow the pattern of cosine with odd /even number of leafs but rotating in 3D.
When we changed the function to bsin(ktheta) we also saw the graphs rotating in the clockwise direction with the nunber of leafs as we stated above. See the graphs below and click this graph motion to see the graph rotation.

Figure 9: bsin(ktheta)